This is an archive of news stories and research from the National Union of Public and General Employees. Please see our new site - https://nupge.ca - for the most current information.
Misleading study fails to take inflation into account when comparing data over nearly half a century.
 Ottawa (23 April 2010) - The Canadian Centre for Policy Alternatives (CCPA) has taken issue with an alarmist Fraser Institute 'Consumer Tax Index' report claiming to show that the average Canadian family’s tax bill has increased by a whopping 1,624% since 1961.
The institute is financed by large corporate contributors and has produced reports for decades that consistently favour big business while attacking the role of the public sector and government.
"There are a lot of things wrong with the Fraser Institute’s math," the CCPA argues, noting first and foremost that the institute fails to adjust its latest numbers for inflation - something any reputable study would do.
"A dollar in 1961 bought a lot more than a dollar today buys so it doesn’t make sense to compare the tax bill in 1961 dollars to the tax bill in 2009 dollars. Once adjusted for inflation, that 1,624% increase shrinks to just 137%," the CCPA says.
"On top of inflation, we need to consider that incomes also grew over the last half a century, so the tax bill would have grown even if we paid the same proportion of our income in taxes in 2009 as in 1961. What we need to compare, then, is not be the change in absolute dollars that families pay in taxes, but the change in the share of family income that goes to pay for taxes."
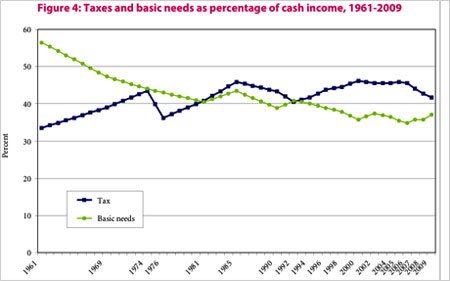
The Fraser Institute says the average family paid 41.7% of their income in taxes in 2009. However, the number is inflated by the contention that business taxes are part of the family tax bill. The institute also fails to note that actual tax levels have fluctuated over the years.
"In 1961, families paid 33.5% of their income on taxes but by 1969 they were paying 39% and in 1974 they paid 43.4% of their income," the CCPA notes.
"So, if you compare the 2009 effective family tax rate to 1961 you will find a 25% increase. But you will only report a 7% increase since 1969 and an actual decrease since 1974," it notes.
"Therein lies the peril of summary statistics – calculating the percent change over time crucially depends on your starting and ending point. A few years either way would result in completely different numbers. And we wonder why people are so suspicious of statistics."
The CCPA says the best way to avoid such statistical tricks is to show as much of the underlying data as possible and to let people see the patterns for themselves, something the Fraser Institute has not done.
In fact, the institute contradicts itself with a historical graphic presentation of tax levels, which it includes in its report (and is included in this article for comparative purposes).
The Fraser Institute’s conclusion that “the average Canadian family’s tax burden has been rising steadily for the better part of 48 years” is clearly not supported by their own graph, the CCPA says.
 |
"The share of income going to taxes rose quite fast in the 1960s and in the decade between 1976 and 1985 but has hovered around 45% ever since. This graph clearly demonstrates that the latest Fraser Institute report is much ado about nothing – the effective tax rate as a share of average family income has been stable over the past quarter century." (from the B.C. office of the CCPA).
NUPGE
The National Union of Public and General Employees (NUPGE) is one of Canada's largest labour organizations with over 340,000 members. Our mission is to improve the lives of working families and to build a stronger Canada by ensuring our common wealth is used for the common good. NUPGE
